
Pivot Tracing
Pivot Tracing lets users define arbitrary metrics over trace data at runtime. It does so by combining two powerful techniques:
- A Happen-Before operator that allows users to perform queries based on the causal relationship of the events.
- The ability to instrument code dinamically without having to redeploy.
How it works
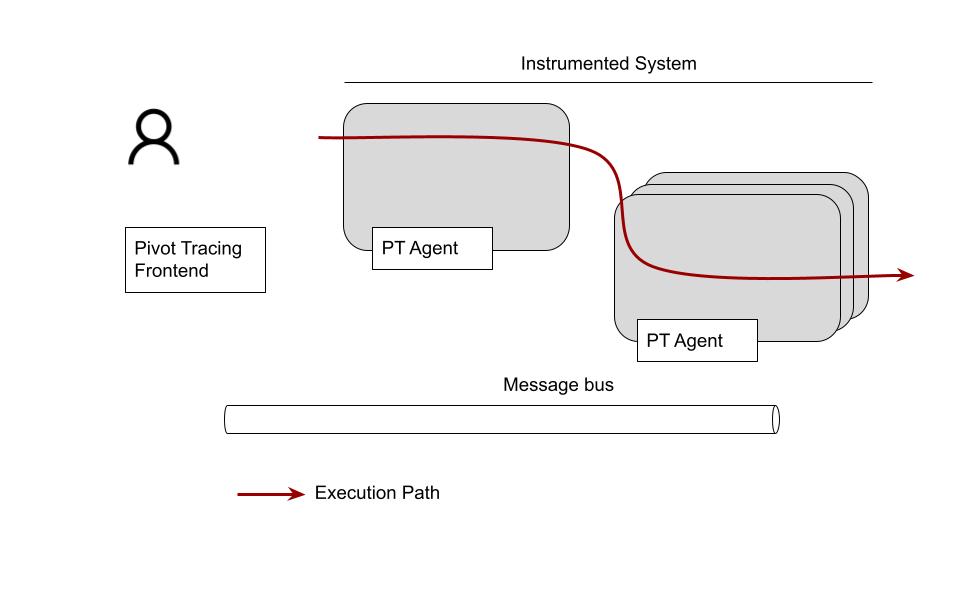
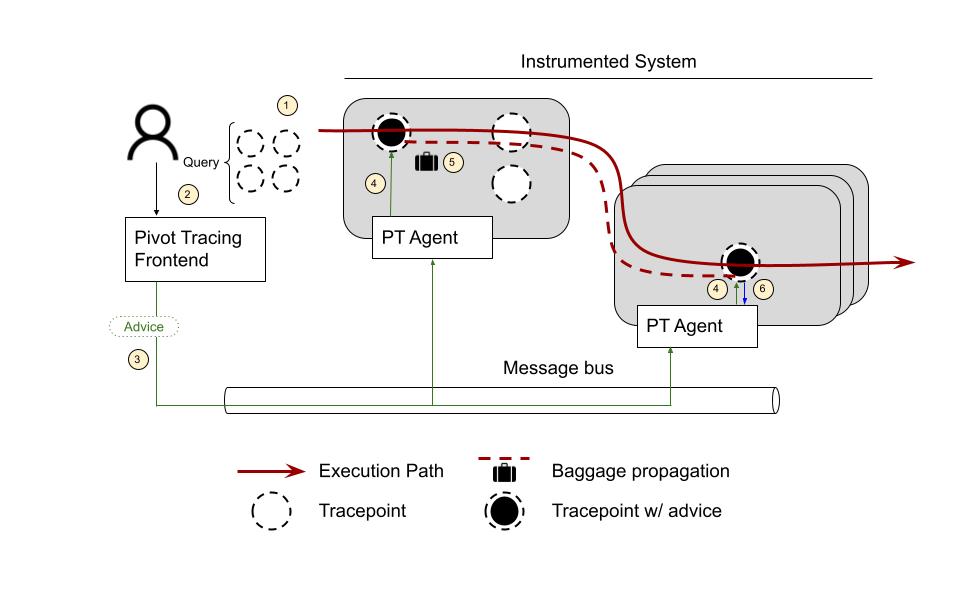
Say we have an instrumented system we want to troubleshoot:
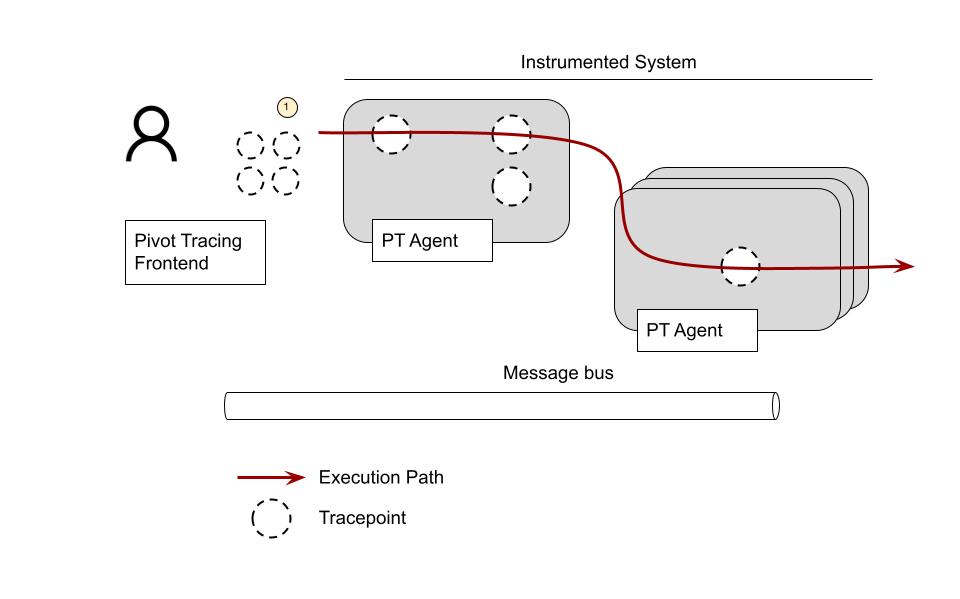
The first step is to define Tracepoints ⓵. Tracepoints are pointers to the source code where the code will be instrumented to collect metrics. They are instructions on where and how to modify the system to extract the required information. You can think of them as pointcuts from aspect-oriented programming. They can refer to any arbitrary interface or method signature or be inserted at specific line numbers.
Tracepoints export variables that can be used to write the queries, such as method arguments or local variables. Some default variables are provided out-of-the-box, such as: host, timestamp, process id, process name, etc.
The cool thing about Tracepoints is that they don’t need to be defined a priori. And since defining a Tracepoint involves no code modification, new ones can be created at no cost.
Tracepoints are created by someone with good system knowledge (such as developers or operators). They define the vocabulary users will use to write the queries.
The next step is to write a query using the terms introduced by the tracepoints ⓶. A query might look something like this:
1 2 3 4 | |
In this example, a Tracepoint exists for the method DataNodeMetrics. incrBytesRead(int delta) and another for the class ClientProtocols. The shown query sums the values of incr.delta grouped by ClientProtocol’s procName. The clause On cl -> incr establishes that we’re interested in only capturing cl events that happened before an incr event. The cool thing is that these two tracepoints belong to two different services! Pivot tracing will know how to propagate the required context needed to do the join and evaluate the happens-before clause.
Once the user submits the query, Pivot Tracing frontend compiles it to something called Advice ⓷. An Advice contains the instructions that need to be executed when a request passes through a Tracepoint to answer the query. These are the operations that can be executed as part of an Advice:
- Observe: Creates a tuple from variables defined by a tracepoint.
- Filter: Evaluates a predicate on all tuples.
- Pack: Makes tuples available for use by later Advice
- Unpack: Retrieves one or more tuples from prior Advice
- Emit:Outputs a tuple for global aggregation.
The Frontend creates these Advice and notifies the PT Agents to install them in the corresponding Tracepoints ⓸.
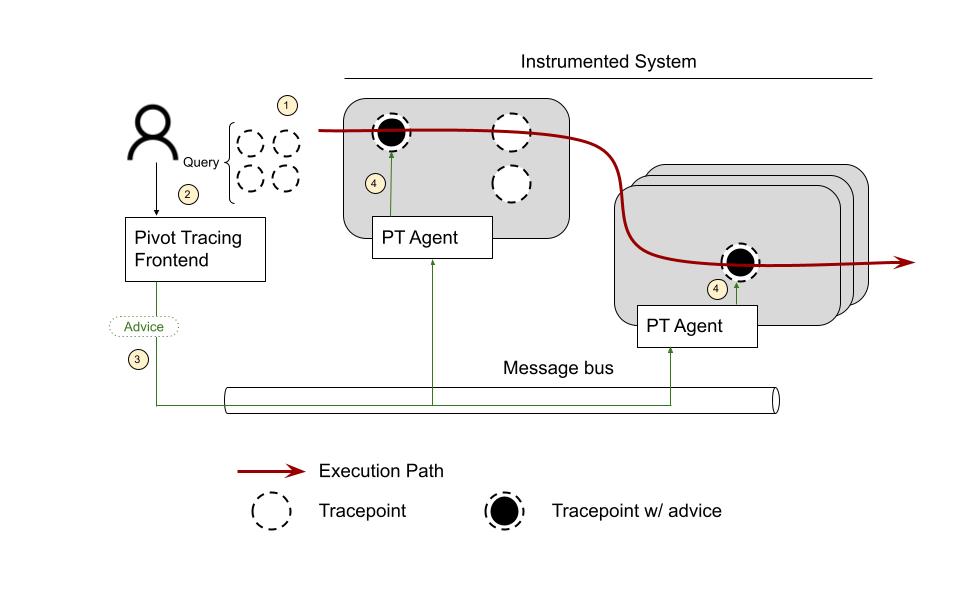
This is done by weaving generated code that gets executed every time a request passes through the Tracepoint.
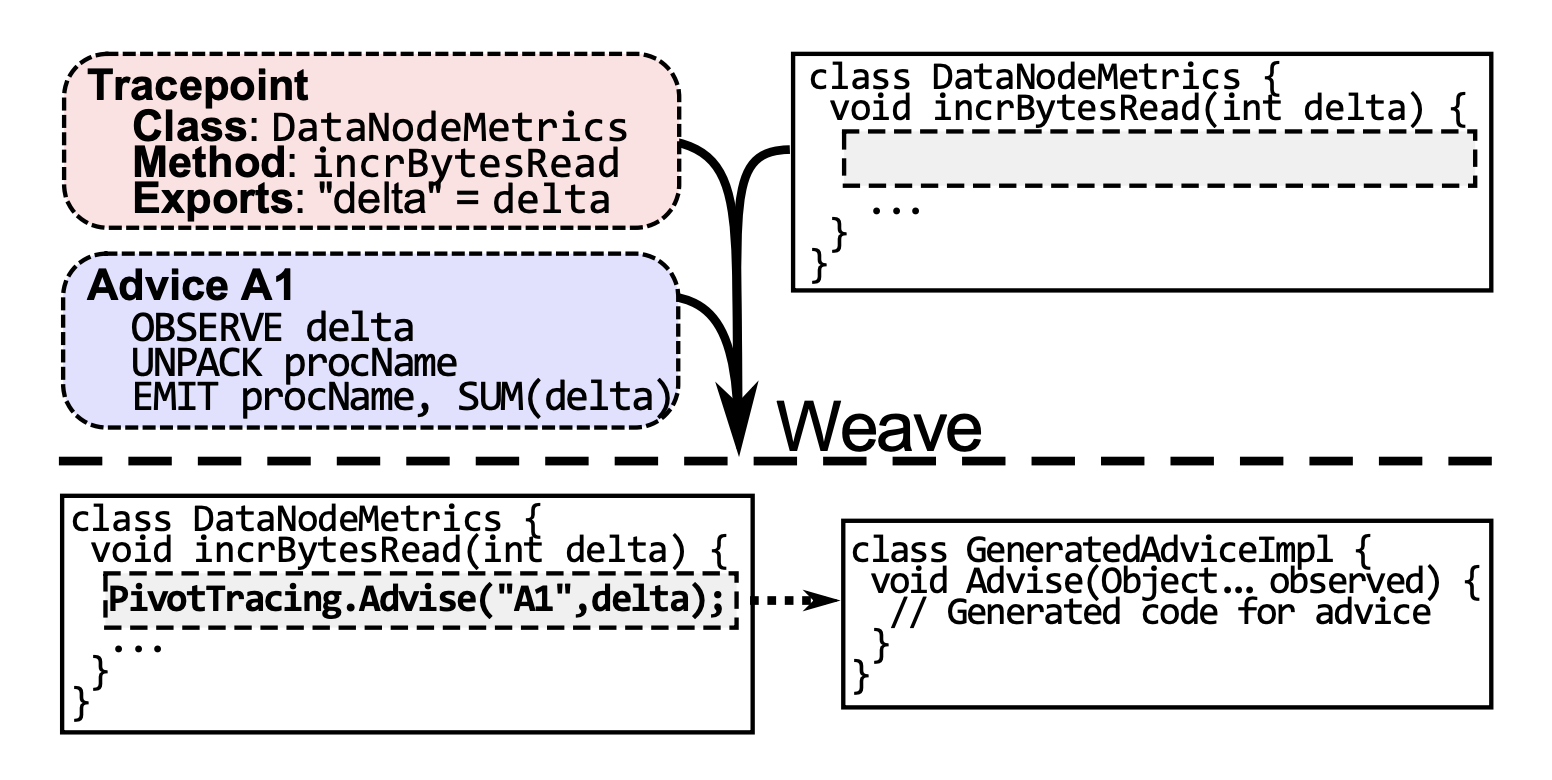
For the query shown above, Advice A1 and A2 would be generated:
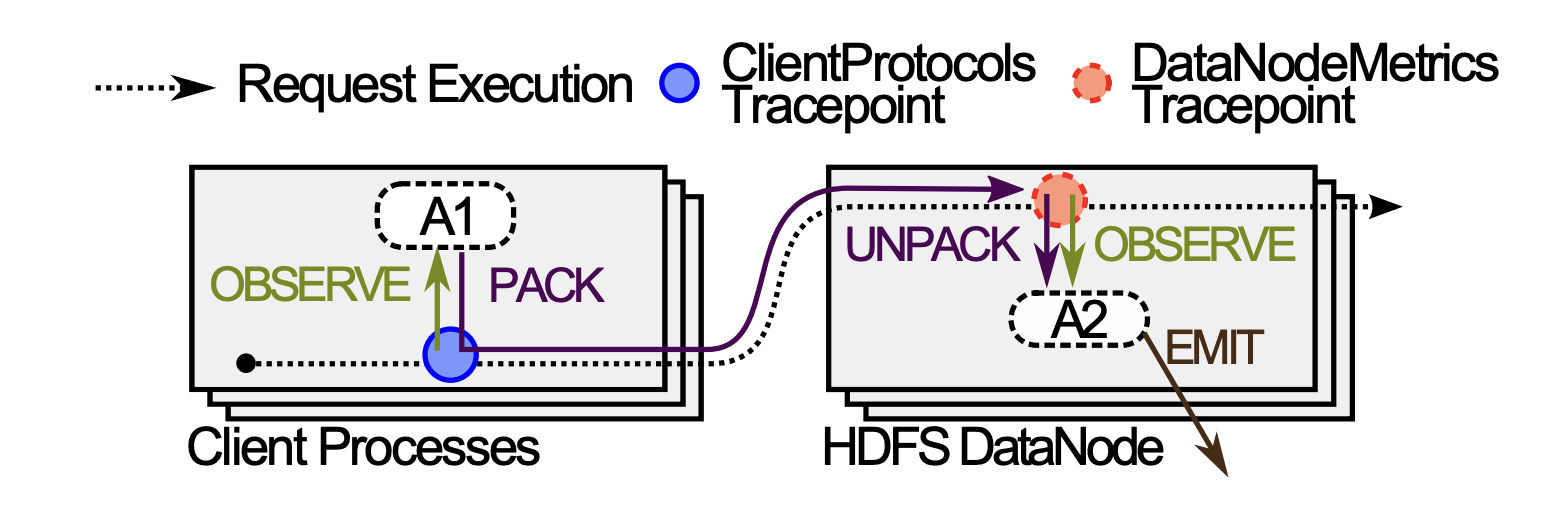
To do the happens-before join required by the query shown above Pivot Tracing needs to propagate the variables captured at ClientProtocols Tracepoint to the DataNodeMetrics Tracepoint. This is done through something called baggage (if you’re familiar with OTel’s baggage it’s basically the same thing). When the request gets to the ClientProtocols Tracepoint, the Advice A1 Observes the variables and Packs them as part of the request baggage ⓹. Later, when the code gets to the DataNodeMetrics Tracepoint, the Advice A2 Unpacks the variables, Observes the value of delta, and Emits a joined tuple ⓺.
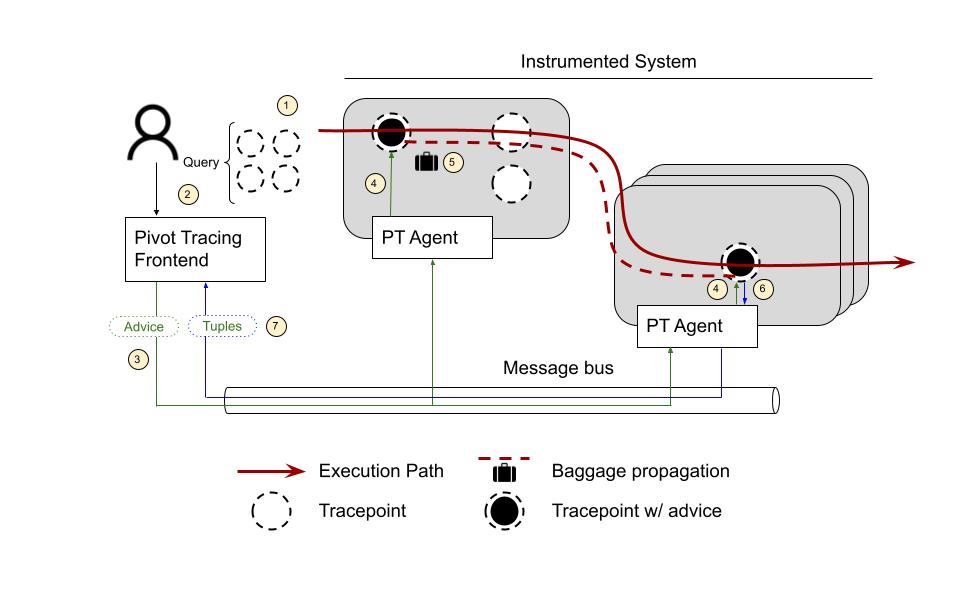
The tuples emitted by DataNodeMetrics Tracepoint ⓺ are aggregated locally and then streamed to the client over the message bus ⓻.
Finally, Pivot Tracing Frontend uses these tuples to answer the user’s query ⓼. And that’s how the whole thing works.
The power of Happens-Before
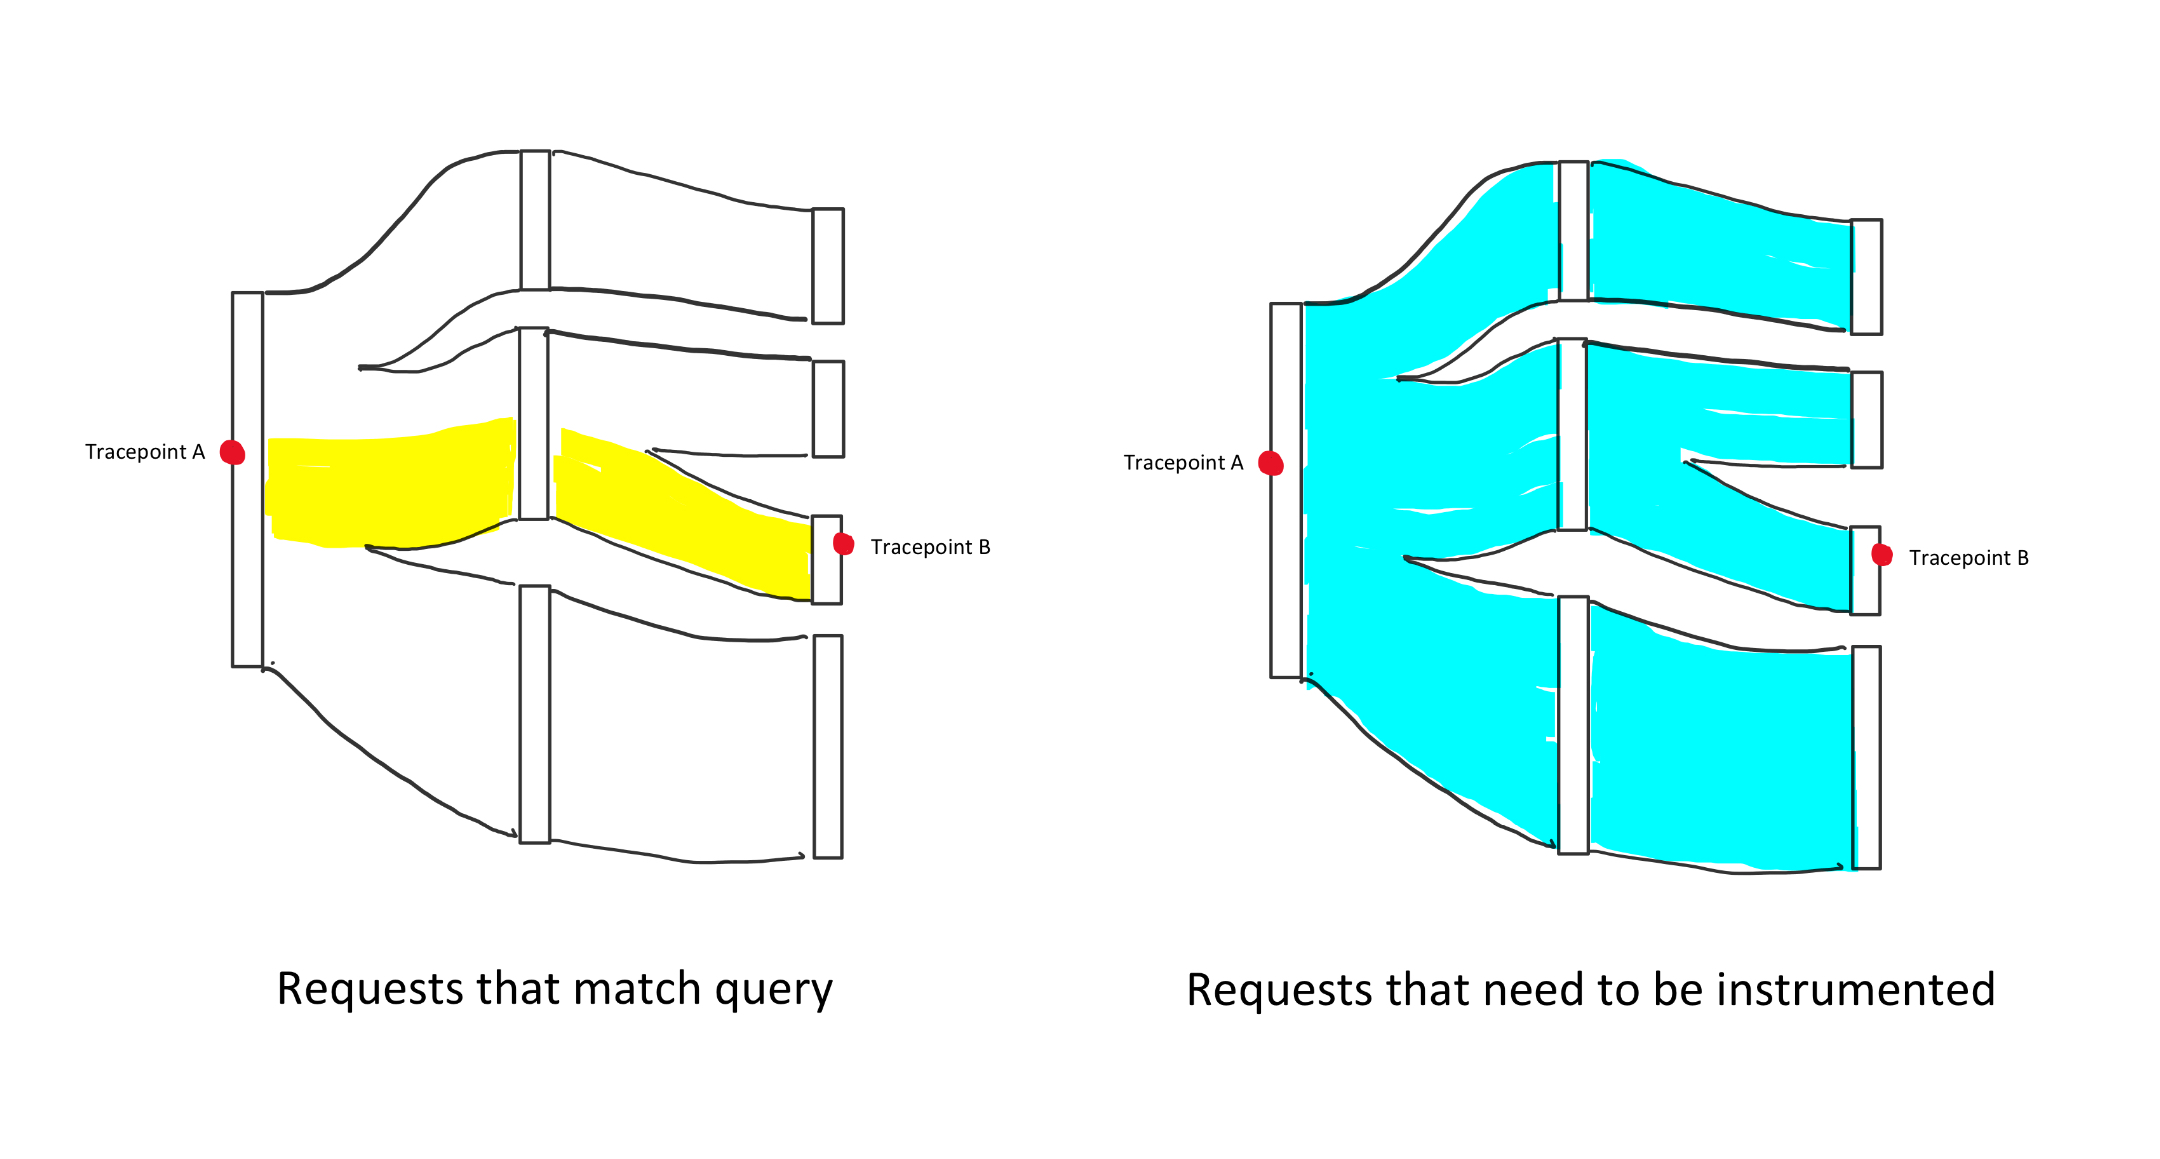
One of the most remarkable features of Pivot Tracing is the Happens-Before operator: ->. With a Happens-Before join, users can tell the system to capture events on Tracepoint B only if the request first passed through Tracepoint A.
Queries that require information from multiple services participating in a request (such as the one shown above) can’t be answered through Logs or Metrics captured on single service. By the time a metric is recorded on Service A, we no longer have the context to know where that request has come from. Distributed Tracing was created to fulfill this gap, to answer the questions Logs and Metrics couldn’t answer. Yet many of today’s most popular frameworks still lack the ability to write causal queries.
Pivot Tracing not only supports this, but it also does it in a cost-efficient manner by only propagating just enough context to answer a given user query. This is only possible thanks to their use of Dynamic Instrumentation.
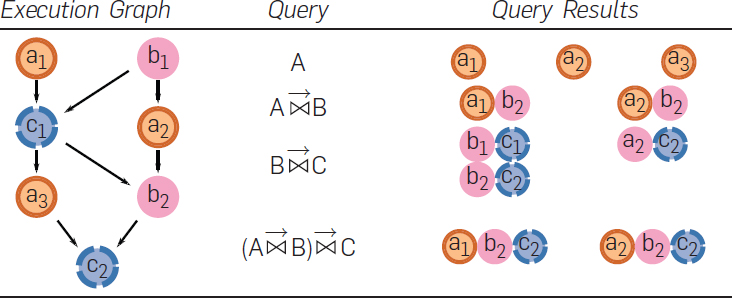
So far, we’ve used a straightforward request path for our examples: Service A -> Service B. It’s worth noting that the requests call graphs tend to be much more complex in real life. The tracepoints the user might be interested in querying could be N levels removed. The image above shows which tuples are captured by each query based on the execution graph.
Pros and cons of Dynamic Instrumentation
We talked about how Pivot Tracing uses AOP to dynamically instrument the code. The promise made by Dynamic Instrumentation is that developers don’t need to worry about deciding what parts of the code to instrument and which tags to record. Instead, Pivot Tracing takes care of making the required code changes to be able to answer any given query.
On paper, this sounds amazing. It means developers don’t need to think about observability storage costs when writing code. They don’t need to consider how traffic spikes and tag cardinality might conspire to make observability prohibitively expensive. It also removes the need to decide what parts of the code are worth measuring at design time, which is great because, by the time you’re troubleshooting an issue, you have a better idea about what kind of questions you might want to ask.
The cost structure makes sense too. Think about all those log lines an application spits per second and how most of the time, only one in a gazillion lines is interesting. Furthermore, Dynamic Instrumentation means the code is only instrumented as a result of a query written by the user, so any cost incurred is well justified because you can guarantee somebody is looking at the emitted data. So basically, you only pay for what you use.
So where’s the catch?
We said that the Pivot Tracing only starts collecting information after the user has submitted a query. This means you only start observing the system after the issue has already occurred. If you’re lucky, it’ll happen again soon, and you’ll be able to gain some insight from the provided query. Now, this is a huge if. Some of the most complex bugs are those that show up every now and then and are only reproducible under rare conditions. For these bugs dynamic instrumentation might not help much. A long running query will have to be installed in place so that information can be collected the next time it happens.
Another downside is that there’s no historical data to use as a baseline. Say users are reporting some page is slow. You can run a query and get a latency breakdown across services, but how do you know if what you’re seeing is an anomaly? Was the system this slow a week ago? Does service X always take more than 3 seconds to answer? Has the request time been affected by the deployment to service Y we made two days ago? These questions can’t be answered without stored observability data to refer to.
The good news is that the choice between static and dynamic instrumentation doesn’t have to be binary. In reality, you’ll want to have a mix of statically instrumented known queries (this is where your dashboard and alerts data will come from), AND some headroom for dynamically instrumented queries for troubleshooting. The final cost ends up being the sum of both types of instrumentation. The cost for static instrumentation is driven by storage cost, whereas the dynamic instrumentation cost is a function of emission cost which depends on the query being executed. Of course, both are directly affected by traffic volume.
Speaking of costs, one of the dangerous aspects of dynamic instrumentation is that the cost is directly influenced by the query provided. The paper describes no way of understanding and evaluating these costs, so they remain virtually hidden from the user writing the query. A given query could result in many kilobytes of Advice being transmitted as baggage across N services. Consider, once more, the query:
1 2 3 4 | |
This is a typical example of a happens-before query. The clause cl -> incr means we only care about incr events if the request first passes through cl. A user without knowledge of how Pivot Tracing works might think that the cost of this query is proportional to the number of requests it matches, but this would be completely wrong. To answer this query, Pivot Tracing must pack Advice in all requests that go through cl. This baggage is then transmitted across all services downstream from cl. This needs to be done because the system doesn’t know a priori which of those requests will then go through incr.
Any given query might affect the baggage content passed across N number of services, and there’s no way of knowing which services will be affected at query time.
To make things even more complicated, the capacity reserved to answer tracing queries is shared across all system users. This introduces a new set of challenges around administering said capacity. Deciding which team should have priority to run a query is not something you want to be dealing with during an incident.
The paper describes a series of query optimizations to keep the baggage level small. It also mentions a possible workaround to avoid packing too many tuples into the baggage, which consists of emitting all tuples instead of packing them. However, even with this workaround, some information still needs to be packed into the request context to be able to reconstruct the causality.
One last concern regarding dynamic instrumentation is that, by definition, a given query modifies the system being observed. If you’ve ever tried troubleshooting a bug only to discover that it doesn’t happen when the application is run on debug mode, you know how annoying this could be. In certain situations running the query might even be counter-productive. For example, consider a user troubleshooting an incident on app performance. Running a Pivot Tracing query will further add extra overhead to the system, making things even worse.
Despite all these pitfalls, I still believe Dynamic Instrumentation is a valuable tool and, I’d love to see it adopted in mainstream distributed tracing frameworks. The ability to write queries about any part of the code without having to manually instrument it’s just too good to pass on. We shouldn’t treat it as the primary instrumentation strategy but as a secondary method of answering complex, more specific queries crafted to troubleshoot particular incidents. Engineers designing these tools need to take extra care and put the proper safeguards in place to avoid users shooting themselves in the foot.
